Unsupervised Machine Learning for
Process-Level Anomaly Detection
Multi-Level OT Cybersecurity
REQUEST SOLUTION DEMO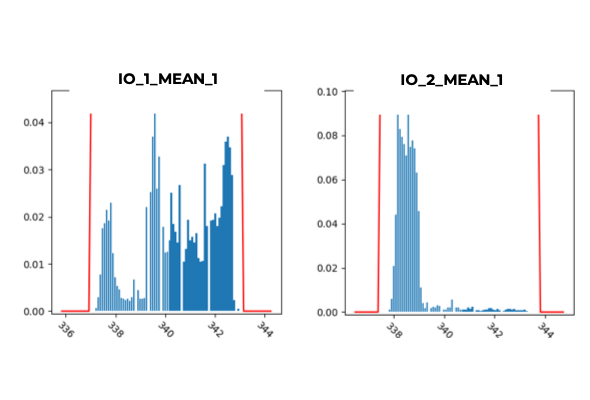
Unsupervised Machine
Learning (ML)
Unsupervised ML identifies patterns and anomalies on its own, without needing explicit guidance. This makes it particularly powerful in environments where new and unknown threats can emerge like “Zero Day” attacks.
These graphs represent the initial baseline established by the Univariate Model. The blue bars indicate the range of normal fluctuations in this variable over time. The red lines represent the boundaries of the normal range. Any data points falling outside these boundaries in future monitoring could signify an anomaly.
Anomaly Detection
(Abnormal Behavior)
After the baseline is set, the models continuously monitor real-time data, comparing it to the baseline to detect any deviations that could signify an anomaly.
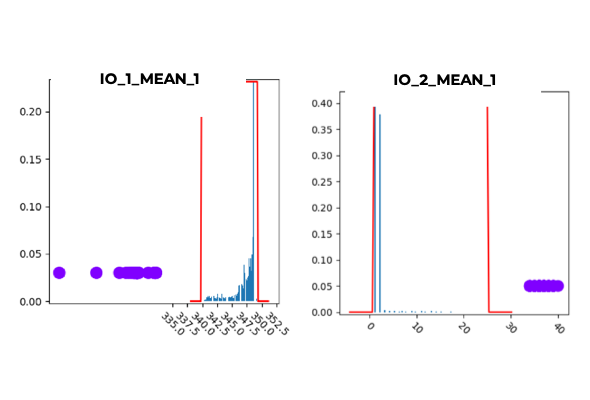
These graphs show a significant deviation from the established baseline. The blue points outside the normal range, marked by the red lines, indicate an anomaly. This behavior could be indicative of a potential issue that requires further investigation.
Predictive Modelling
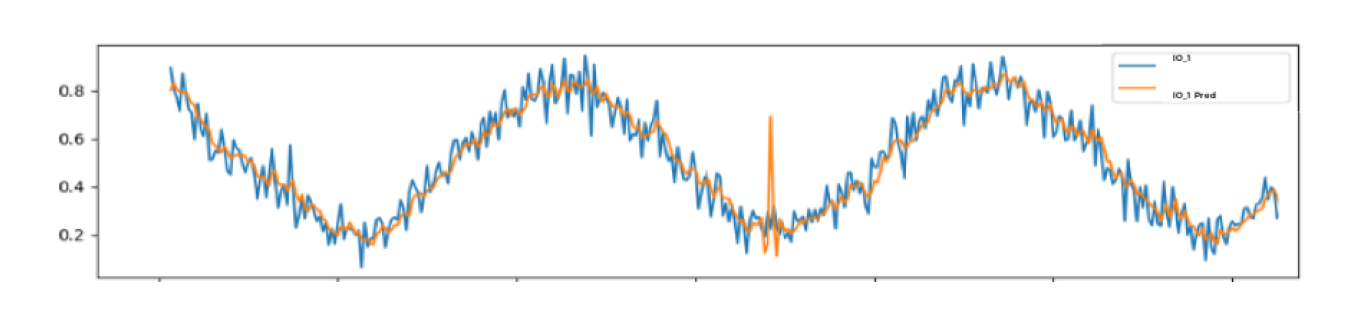
In the image above, there are two lines: one representing the predicted
behavior and the other showing the actual behavior.
Any divergence between these lines indicates a deviation that the model
has flagged as a potential concern.
Go Deeper
Learn how SigaML2 applies unsupervised machine learning to detect anomalous process behavior across all Purdue Model levels.